reports(2026)
Learn what reports are, why they matter, and how to create clear, actionable reports that drive decisions.
In a business context, a report is more than a collection of numbers. It’s a structured narrative that explains what happened, why it happened, and what to do next. Reports inform stakeholders, guide strategic decisions, and support accountability. They can vary in scope from a quick weekly update to a comprehensive annual analysis. The core idea remains the same: present evidence clearly so readers can act confidently.
Types of reports and when to use them
| Report Type | When to use | Key Strength | Typical Audience | Data Source | Frequency |
|---|---|---|---|---|---|
| Quick Status | One-time snapshot for executives | Clear at-a-glance metrics | Executives, PMs | Live dashboard, CSV | Weekly or monthly |
| Operational | Day-to-day monitoring | Timely alerts, drill-downs | Analysts, ops teams | ERP, CRM, logs | Daily |
| Compliance | Regulatory filings | Audit-ready, traceable | Auditors, management | Logs, controls, policies | Quarterly |
| Management | Performance tracking | Goals vs. actuals | Managers, sponsors | BI, planning tools | Monthly |
| Incident Report | Post-event review | Root-cause, remediation | DevOps, security | incident tickets, logs | As needed |
| Financial | Financial health | P&L, cash flow | CFO, controllers | GL, ERP | Monthly, quarterly |
| Project Report | Project status | Milestones, risks | Project leads | PM tools, Jira | weekly / biweekly |
Compiled November 2026; check the provider's site for current details.
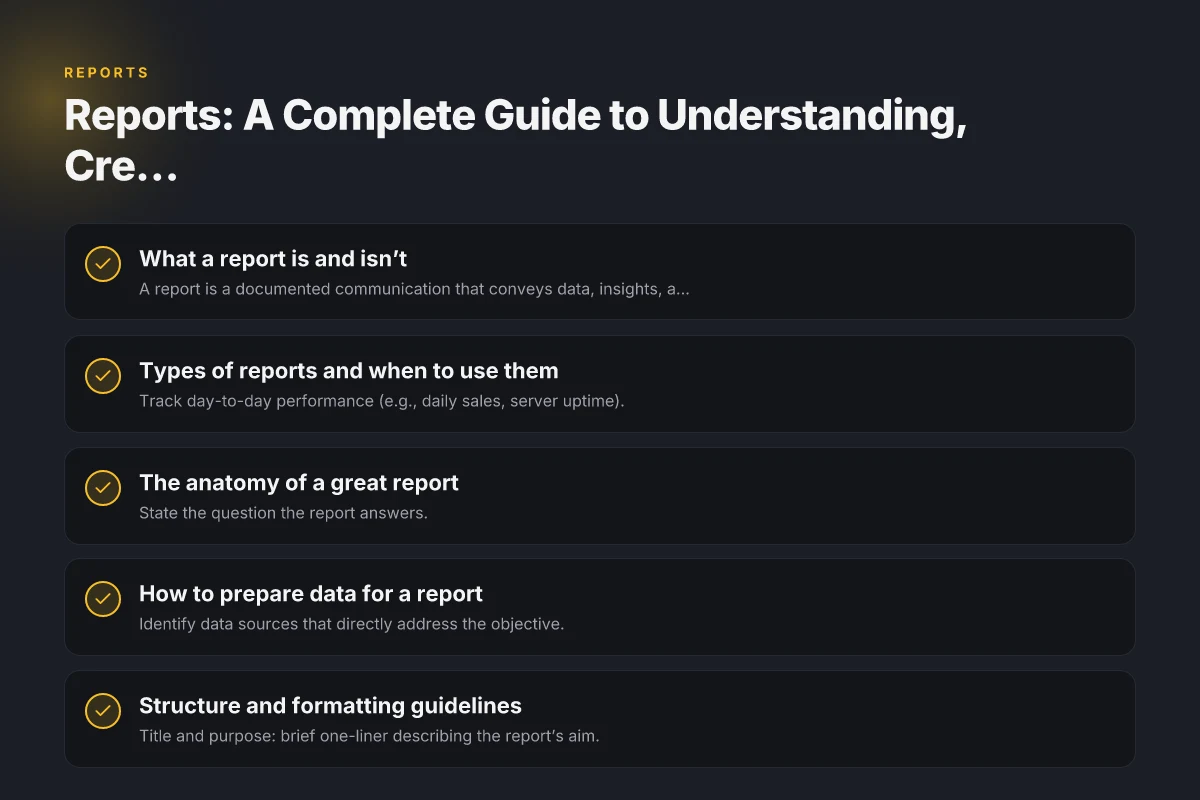
What a report is and isn’t
Definition and purpose
- A report is a documented communication that conveys data, insights, and recommendations.
- It is usually written for an audience that needs to understand a situation, assess options, and decide on a course of action.
- It combines facts with interpretation, but it should separate data, analysis, and conclusions.
Common misconceptions
- A report is not just a dump of data. Raw numbers without context are rarely helpful.
- A report is not only for executives. Team members, customers, and partners also rely on reports tailored to their needs.
- A report is not a one-off document. It should be repeatable, versioned, and auditable.
Types of reports and when to use them
Operational reports
- Track day-to-day performance (e.g., daily sales, server uptime).
- Short, time-bound, actionable.
Management reports
- Provide insights on performance against targets, with variance analysis.
- Focus on trends, root causes, and recommended actions.
Financial reports
- Present revenue, costs, profitability, cash flow.
- Comply with accounting standards and provide a clear view of financial health.
Strategic and executive reports
- Synthesize market context, strategic progress, risk, and opportunities.
- Support long-term decisions and governance.
Specialized reports
- Compliance, audit, customer analytics, project status, risk assessments, etc.
- Tailored to domain requirements and stakeholder needs.
The anatomy of a great report
Clear objective
- State the question the report answers.
- Tie every section back to the objective.
Audience-aware tone and structure
- Executive readers get a concise executive summary.
- Analysts get methods, data sources, and caveats.
Data integrity and sources
- List data sources, methods, and any limitations.
- Note any assumptions and data quality issues.
Findings, implications, and recommendations
- Separate what happened (findings) from what it means (implications).
- End with concrete, prioritized recommendations.
Visuals and storytelling
- Use visuals to support, not overwhelm.
- Tell a story with a logical flow: context, evidence, interpretation, action.
The anatomy of a great report
| Element | Purpose | Example indicators | Format cue | Typical readers | Accessibility note |
|---|---|---|---|---|---|
| Title | Identify purpose | "Q3 Sales Review" | bold header | All stakeholders | large font on first page |
| Summary | Quick takeaways | 3-5 bullets | concise prose | Executives | avoid jargon |
| Visuals | Reinforce data | Bar, line charts | captions | Analysts, managers | accessible colors |
| Data table | Detail backing | Key figures, filters | sortable | Specialists | provide export option |
| Methodology | How data was derived | definitions, date range | footnote | auditors, skeptics | include data lineage |
| Footnotes | Clarify assumptions | definitions, exclusions | small text | all readers | link to glossary |
Compiled November 2026; check the provider's site for current details.
How to prepare data for a report
Gather relevant data
- Identify data sources that directly address the objective.
- Ensure data timeframe aligns with the report’s scope.
Clean and standardize
- Fix gaps, resolve duplicates, and normalize formats.
- Document cleaning steps for transparency.
Validate and triangulate
- Cross-check figures with independent sources or calculations.
- Flag discrepancies and explain them.
Document metadata
- Include date ranges, data owners, and version numbers.
- Provide a glossary for any domain-specific terms.
Structure and formatting guidelines
The standard sections
- Title and purpose: brief one-liner describing the report’s aim.
- Executive summary: key insights and recommended actions.
- Methodology: data sources, metrics, calculations, caveats.
- Findings: structured bullet points or concise paragraphs.
- Implications and actions: what readers should do next.
- Appendices: detailed tables, charts, or supplementary materials.
A practical template (line-by-line)
- Title: [Report Title]
- Date: [YYYY-MM-DD]
- Objective: [What question are we answering?]
- Summary: [Top 3 insights and actions]
- Data sources: [List and links if applicable]
- Key metrics: [KPI list with definitions]
- Findings: [Bullet list with evidence and interpretation]
- Recommendations: [Prioritized actions with owners and timeline]
- Appendix: [Detailed tables, calculations, charts]
Visuals that reinforce, not distract
Best practices
- Use one idea per chart. Avoid clutter.
- Label axes, define units, and include data source.
- Choose color palettes with accessibility in mind (contrast, colorblind-friendly).
Chart types by purpose
- Trend lines for changes over time.
- Bar or column charts for comparisons.
- Heatmaps for density or frequency.
- Pivot tables for multidimensional views.
- Gantt charts for project timelines.
Table: Quick comparison of report formats
| Format | Pros | Cons | Best Use |
|---|---|---|---|
| Narrative report | Clear storytelling, context-rich | Can be lengthy, subjective | Executive summaries, case studies |
| Dashboard | Real-time; concise visuals | May oversimplify | Operational monitoring, quick decisions |
| Data appendix | Detailed, auditable | Less readable standalone | Compliance, audits, deep dives |
| Slide deck | Easy to share; highlight-focused | Can omit detail | Presentations, executive reviews |
How to prepare data for a report guestbook(2026)
| Step | Action | Input | Output | Responsibility | Timing |
|---|---|---|---|---|---|
| Define purpose | Clarify goal | Stakeholder ask | Report scope | Data owner | Upfront |
| Gather sources | Inventory data | Data sources list | Source map | Data engineer | Early |
| Clean data | Remove duplicates | Raw data | Clean dataset | Data ops | Before modeling |
| Transformations | Normalize fields | Mappings | Standardized schema | Data engineer | During prep |
| Enrichment | Add context | Third-party data | Enriched records | Analyst | Mid |
| Validation | Check accuracy | Rules | Validated data | QA | Pre-release |
Compiled November 2026; check the provider's site for current details.
Quality checks and governance
Review and iteration
- Have a peer review for accuracy and clarity.
- Iterate on feedback and test with a sample audience.
Version control
- Use a consistent naming convention (e.g., ReportName_v1.0_YYYYMMDD).
- Maintain a changelog to capture edits and approvals.
Accessibility and inclusivity
- Provide alt text for images and tables.
- Use plain language and avoid jargon where possible.
- Ensure the report is usable by people with varying levels of expertise.
Distribution and use of reports
Delivery methods
- PDF for formal documentation and archiving.
- Interactive dashboards for ongoing monitoring.
- Shared folders or BI platforms for stakeholder access.
Embedding into workflows
- Schedule regular delivery with reminders for stakeholders.
- Tie reports to decision calendars (monthly reviews, quarterly planning).
Actionability
- Include clear next steps, owners, and deadlines.
- Link findings to business outcomes or KPIs.
Common pitfalls and how to avoid them
- Overloading with data: Resist the urge to include every metric. Focus on what matters to the objective.
- Ambiguity in conclusions: Always connect findings to a conclusion and a recommended action.
- Poor data provenance: Always cite sources and methods. Avoid “data my eyes tell me.”
- Inconsistent metrics: Use standardized definitions across reports to prevent confusion.
Practical examples by industry
- Marketing: A quarterly campaign performance report with audience segmentation, CAC, LTV, attribution models, and recommended optimizations.
- Sales: A weekly pipeline report showing funnel stages, win rates, average deal size, and next-quarter forecast.
- Operations: A daily performance report with uptime, MTTR, throughput, and on-time delivery metrics.
- HR: A monthly headcount, turnover, diversity metrics, and initiatives effectiveness.
The recommendation: choosing the right reporting approach
- Start with a clear objective and audience.
- Select a format that matches the audience’s needs and decision context (operational dashboards for frontline teams, executive summaries for leadership, detailed data appendices for analysts).
- Prioritize clarity, brevity, and credibility. A great report is readable without needing a separate explanation.
- Build in governance: version control, standard templates, and a review process to ensure consistency over time.
If you want a straightforward plan to produce effective reports, you can begin with a one-page executive summary template and a simple data appendix. Use this to test with your target audience, gather feedback, and then expand into a full report with sections that mirror the feedback you receive. With practice, your reports will become reliable tools that inform decisions and drive actions across your organization.