statistics(2026)
A practical guide to statistics that explains core ideas, methods, and how to interpret data in real life.
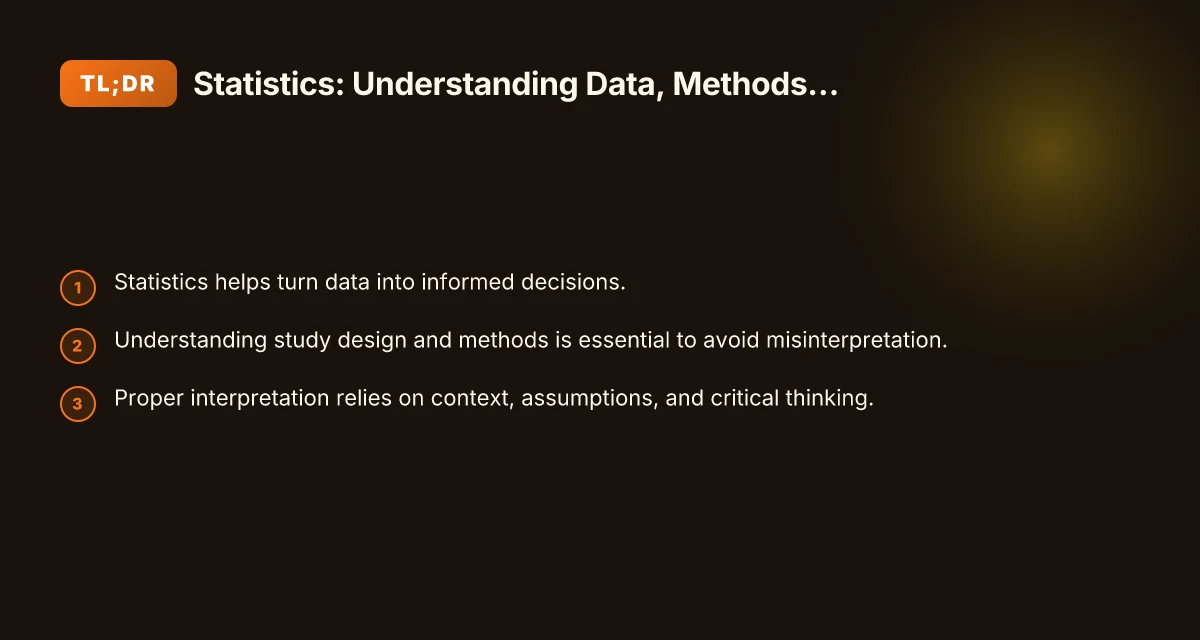
Statistics is the science of collecting, analyzing, and interpreting data. It sits at the intersection of mathematics, research design, and everyday decision-making. Whether you’re reading a news article, evaluating a study, or planning your own survey, a solid grasp of statistics helps you separate signal from noise and draw meaningful conclusions.
Table 1 — Compare statistics concepts and what they measure
| Concept | What it measures | Typical data type | Common pitfall | Example use |
|---|---|---|---|---|
| Mean | Central tendency | Numeric | Sensitive to outliers | Quick summary of scores |
| Median | Central tendency | Numeric | Misleading with bimodal data | Midpoint value in skewed data |
| Mode | Most frequent | Categorical/numeric | Not representative | Most common category |
| Variance/SD | Variability | Numeric | Confusing SD with range | Spread of data around mean |
| p-value | Significance | Numeric | Misinterpretation as truth | Assess evidence against null |
| Confidence interval | Uncertainty | Numeric | Wide intervals = no info | Range likely to contain true value |
Compiled November 2026; check the provider's site for current details.
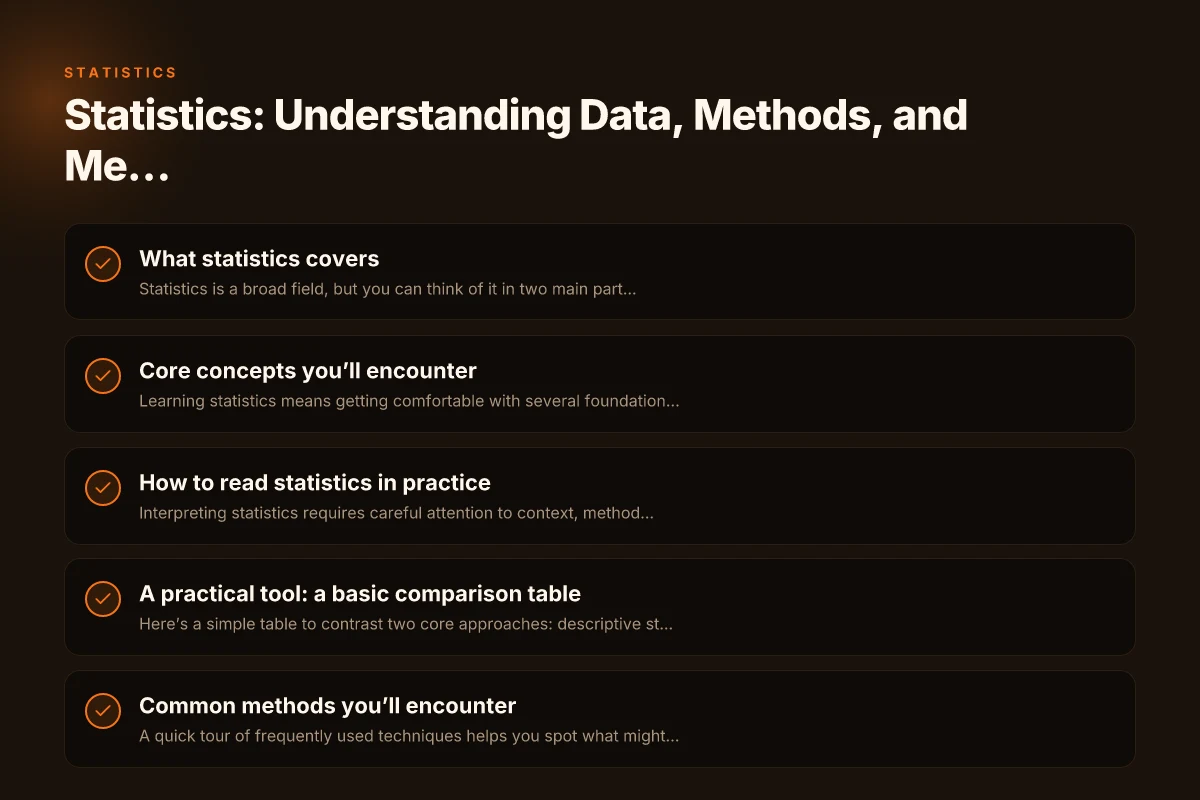
What statistics covers
Statistics is a broad field, but you can think of it in two main parts: descriptive statistics and inferential statistics.
Descriptive statistics
This is about summarizing data so you can see what’s going on at a glance. Common tools include:
- Averages (mean, median, mode)
- Measures of spread (range, variance, standard deviation)
- Frequency counts and proportions
- Visualizations (histograms, bar charts, box plots)
Descriptive statistics describe the sample you collected. They don’t tell you about the larger population beyond your data.
Inferential statistics
Inferential statistics take a step further: they try to infer something about a population from a sample. Key concepts include: accredited programs(2026)
- Sampling from a population
- Hypothesis testing (e.g., p-values)
- Confidence intervals
- Regression and correlation
- Significance and practical relevance
The goal is to generalize findings while acknowledging uncertainty.
Core concepts you’ll encounter
Learning statistics means getting comfortable with several foundational ideas.
Variability and uncertainty
Data are rarely identical. Variation comes from real differences and random chance. Statistics quantifies this variability so we can say how reliable our conclusions are.
Sampling and representativeness
A sample should reflect the population we want to learn about. Poor sampling can bias results. Random sampling is a common method to improve representativeness, though it isn’t always feasible. instabase web engine(2026)
Probability basics
Probability underpins much of inferential statistics. It helps us model how likely observed results are if a hypothesis is true. Common ideas include independent events, conditional probability, and distributions.
Common distributions
Normal distribution (bell curve) is a workhorse in statistics, but many situations involve other distributions (binomial, Poisson, t-distribution). Knowing when to use which distribution matters for accurate analysis.
Hypothesis testing vs. estimation
- Hypothesis testing asks whether observed data contradict a null hypothesis.
- Estimation focuses on quantifying an unknown parameter with a point estimate and an interval (confidence interval).
P-values and confidence intervals
- A p-value measures how surprising the data would be if the null hypothesis were true. It’s not a measure of practical importance.
- A confidence interval provides a range of plausible values for a parameter, given the data and a chosen confidence level (e.g., 95%).
How to read statistics in practice
Interpreting statistics requires careful attention to context, methods, and limitations.
Check the study design
- Who was studied? How were they selected?
- Was there randomization, blinding, or controls?
- Is the study observational or experimental?
Look at the sample size
Smaller samples tend to yield less precise estimates and wider confidence intervals. Large samples can detect tiny effects that may not matter in practice. pq news(2026)
Identify the effect size
A statistically significant result isn’t always practically important. Look for the magnitude of the effect and its real-world implications.
Consider uncertainty
Confidence intervals, margins of error, and p-values all reflect uncertainty. Wider intervals imply less precision.
Beware of multiple comparisons
Testing many hypotheses increases the chance of false positives. Proper adjustments (like Bonferroni correction) help control this risk.
Understand limitations
Correlations do not imply causation. Observational studies can suggest associations but not prove causality without strong design or prior evidence. management structures(2026)
A practical tool: a basic comparison table
Here’s a simple table to contrast two core approaches: descriptive statistics vs inferential statistics.
| Aspect | Descriptive statistics | Inferential statistics |
|---|---|---|
| Purpose | Summarize data from a sample | Generalize to a population |
| Main outputs | Averages, spread, charts | Confidence intervals, p-values, estimates |
| Data type | Descriptive summaries | Inferences under uncertainty |
| Example | Average height of surveyed students | 95% CI for the population mean height |
Table 2 — How to read statistics in practice for decision making
| Situation | Measure to check | Question to ask | Decision cue | Data quality note |
|---|---|---|---|---|
| Comparing groups | Effect size | Is the effect meaningful? | Prefer larger effect with precision | Check sample sizes |
| Assessing reliability | Cronbach's alpha / test-retest | Is measurement consistent? | Reliability >= 0.7 usually good | Report method used |
| Risk/benefit evaluation | Absolute risk difference | How big is the change? | Favor substantial benefits | Consider baseline risk |
| Predictive usefulness | Accuracy / AUC | How well predicts? | Higher is better, but context matters | Validate on new data |
| Generalizability | Sample representativeness | Does it apply here? | Be cautious if non-representative | Note population |
Compiled November 2026; check the provider's site for current details.
Common methods you’ll encounter
A quick tour of frequently used techniques helps you spot what might be appropriate in different situations. northern ireland post qualifying(2026)
Measures of central tendency
- Mean: arithmetic average
- Median: middle value when ordered
- Mode: most frequent value
Measures of dispersion
- Range: difference between max and min
- Variance and standard deviation: how spread out values are
- Interquartile range: range of the middle 50%
Correlation and regression
- Correlation measures the strength and direction of a linear relationship.
- Regression models quantify how one variable changes with another, and can be used for prediction.
Hypothesis testing basics
- Null hypothesis: no effect or no difference
- Alternative hypothesis: there is an effect or difference
- Significance level (alpha): threshold for deciding if results are unlikely under the null
- P-value: probability of observing the data (or more extreme) if the null is true
Confidence intervals
- Provide a range within which the true population parameter is likely to lie
- Wider intervals indicate more uncertainty. Narrower intervals indicate greater precision, given the data
Common pitfalls to avoid
- Misinterpreting p-values as measures of importance or probability that the null is true.
- Ignoring selection bias and non-representative samples.
- Overstating causality from correlational data.
- Cherry-picking results or not reporting uncertainty.
- Confusing the absence of evidence with evidence of absence.
When statistics informs decisions
Statistics is a practical tool for:
- Business and economics: market research, A/B testing, forecasting
- Medicine and public health: clinical trials, epidemiology, risk assessment
- Education and social sciences: surveys, performance metrics, policy evaluation
- Everyday life: consumer surveys, sports analytics, quality control
The power of statistics lies not in formulas alone but in the disciplined process: ask a clear question, design a suitable study, collect data carefully, analyze with appropriate methods, and interpret with context and humility.
Table 3 — A practical tool: a basic comparison table for study choices
| Option | Data requirements | Strengths | Limitations | When to choose | Quick note |
|---|---|---|---|---|---|
| Observational study | Existing data; no intervention | Real-world; inexpensive | Confounding risk | When RCT not feasible | Adjust for confounders |
| Randomized trial | Random assignment | Highest internal validity | Costly; ethical limits | When causal effect needed | Pre-register outcomes |
| Quasi-experimental | Some assignment control | Practical; real-world | Residual bias | When randomization not possible | Use matching/controls |
| Meta-analysis | Aggregated studies | Increases precision | Heterogeneity risk | When plenty of studies exist | Check publication bias |
Compiled November 2026; check the provider's site for current details. links to other sites(2026)
A short example: comparing two teaching methods
- Question: Does Method A improve test scores more than Method B?
- Design: Randomly assign students to two groups, control for prior ability.
- Analysis: Compare mean score gains. Compute a confidence interval for the difference. Check for practical significance.
- Interpretation: If the mean difference is large and the confidence interval excludes zero, and the effect size is meaningful, there’s evidence favoring Method A. If not, the difference may be inconsequential, and other factors should be considered.
Putting it into practice: a quick checklist
- Define the question and the population of interest.
- Choose an appropriate study design (experimental vs observational).
- Ensure a reasonable sample size and representative sampling if possible.
- Plan analysis with suitable methods and pre-specify primary outcomes.
- Report estimates with measures of uncertainty, not just p-values.
- Consider limitations, potential biases, and alternative explanations.
Recommendation
If you want to become more proficient with statistics, start by identifying a real-world question you care about and trace through the steps above. Practice reading research articles with a critical eye: examine the design, the data, the analysis, and the conclusions. Supplement your learning with beginner-friendly statistics courses or guided tutorials that emphasize interpretation as much as computation. Building intuition about variability, uncertainty, and the connection between data and claims will serve you in academia, career, and daily life.